ex3_3 Equality constrains and unrestricted variables
本文共 5743 字,大约阅读时间需要 19 分钟。
matlab source code:
% Ex3_3.m% Example 3.3% Optimization Using MATLAB by P.Venkataraman%% Using drawLine.m %drawLine(0,6,1,1,5,'l');drawLine(0,6,2,1,4,'e');drawLine(0,6,1,1,1,'g');drawLine(0,6,2,-1,8,'n');xlabel('Hours spent studying');ylabel('Hours of pin ball');title('Example 3.3 -Equality Constraint and Negative Design Variables')grid % drawLine.m% Drawing linear constraints for LP programming problems% Dr. P.Venkataraman% Optimization Using Matlab% Chapter 3 - linear Programming%% Lines are represented as: ax + by = c ( c >= 0)% x1, x2 indicate the range of x for the line% typ indicates type of line being drawn l (<=)% g, (>=)% n (none)%% The function will draw line(s) in the figure window% the green line represents the actual value % of the constraint% the red dashed line is 10 % larger or smaller% (in lieu of hash marks)% the limit constraints are identifies in magenta color% the objective function is in blue dashed lines%function ret = drawLine(x1,x2,a,b,c,typ)% recognize the types and set colorif (typ == 'n') str1 = 'b'; str2 = 'b'; cmult = 1;elseif (typ == 'e') str1 ='m'; str2 ='m'; else str1 = 'g'; str2 = 'r';end% values for drawing hash marks% depending on the direction of inequalityif (typ ~= 'n' | 'e') if (typ == 'l') cmult = +1; else cmult = -1; endend% set up a factor for drawing the hash constraintif (abs(c) >= 10) cfac = 0.025;elseif (abs(c)> 5) & (abs(c) < 10) cfac = 0.05;else cfac = 0.1;endif (c == 0 ) cdum = cmult*0.1; else cdum = (1 + cmult* cfac)*c;end% if b = 0 then determine end points of line x lineif ( b ~= 0) y1 = (c - a*x1)/b; y1n = (cdum - a* x1)/b; y2 = (c - a* x2)/b; y2n = (cdum - a*x2)/b;else % identfy limit constraints by magenta color str1 = 'm'; str2 = 'm'; y1 = x1; % set y1 same length as input x1 y2 = x2; % set y2 same length as input x2 x1 = c/a; % adjust x1 to actual value x2 = c/a; % adjust x2 to actual value y1n = 0; % set y = 0; y2n = 0; % set y = 0endif (a == 0) str1 = 'm'; % set color for limit line str2 = 'm'; % set color for limit lineend;% draw axis with solid black colorhh = line([x1,x2],[0,0]);set(hh,'LineWidth',1,'Color','k');hv = line([0,0],[x1,x2]);set(hv,'LineWidth',1,'Color','k');% start drawing the linesh1 = line([x1 x2], [y1,y2]);if (typ == 'n') set(h1,'LineWidth',2,'LineStyle','--','Color',str1);else set(h1,'LineWidth',1,'LineStyle','-','Color',str1);endif (b ~= 0)&(a ~= 0) text(x1,y1,num2str(c));endif( b == 0)|(a == 0)| (typ == 'n') | (typ == 'e') grid ret = [h1]; return, end grid;h2 = line([x1 x2], [y1n,y2n]);set(h2,'LineWidth',0.5,'LineStyle',':','Color',str2);gridhold onret = [h1 h2];here, I would like to analysis drawLine.m
% drawLine.m
% Drawing linear constraints for LP programming problems % Dr. P.Venkataraman % Optimization Using Matlab % Chapter 3 - linear Programming % % Lines are represented as: ax + by = c ( c >= 0) % x1, x2 indicate the range of x for the line % typ indicates type of line being drawn l (<=) % g, (>=) % n (none) % % The function will draw line(s) in the figure window % the green line represents the actual value % of the constraint % the red dashed line is 10 % larger or smaller % (in lieu of hash marks) % the limit constraints are identifies in magenta color % the objective function is in blue dashed lines % function ret = drawLine(x1,x2,a,b,c,typ) % recognize the types and set color if (typ == 'n') str1 = 'b'; str2 = 'b'; cmult = 1; elseif (typ == 'e') str1 ='m'; str2 ='m'; else str1 = 'g'; str2 = 'r'; end str1是第一根线的颜色,str2是第二根线的颜色 % values for drawing hash marks % depending on the direction of inequality if (typ ~= 'n' | 'e') if (typ == 'l') cmult = +1; else cmult = -1; end end 确定第二根线的挪动方向 % set up a factor for drawing the hash constraint if (abs(c) >= 10) cfac = 0.025; elseif (abs(c)> 5) & (abs(c) < 10) cfac = 0.05; else cfac = 0.1; end if (c == 0 ) cdum = cmult*0.1; else cdum = (1 + cmult* cfac)*c; end 确定挪动的距离 % if b = 0 then determine end points of line x line if ( b ~= 0) y1 = (c - a*x1)/b; y1n = (cdum - a* x1)/b; y2 = (c - a* x2)/b; y2n = (cdum - a*x2)/b;确定第一根线和第二根线的方程
h1 = line([x1 x2], [y1,y2]); [x1 x2]为x的范围, [y1,y2]为y的范围
h2 = line([x1 x2], [y1n,y2n]);
else % identfy limit constraints by magenta color str1 = 'm'; str2 = 'm'; y1 = x1; % set y1 same length as input x1 y2 = x2; % set y2 same length as input x2 x1 = c/a; % adjust x1 to actual value x2 = c/a; % adjust x2 to actual value y1n = 0; % set y = 0; y2n = 0; % set y = 0当线垂直的情况
end if (a == 0) str1 = 'm'; % set color for limit line str2 = 'm'; % set color for limit line end; % draw axis with solid black color hh = line([x1,x2],[0,0]); set(hh,'LineWidth',1,'Color','k'); hv = line([0,0],[x1,x2]); set(hv,'LineWidth',1,'Color','k'); % start drawing the lines h1 = line([x1 x2], [y1,y2]); if (typ == 'n') set(h1,'LineWidth',2,'LineStyle','--','Color',str1); else set(h1,'LineWidth',1,'LineStyle','-','Color',str1); end if (b ~= 0)&(a ~= 0) text(x1,y1,num2str(c)); end if( b == 0)|(a == 0)| (typ == 'n') | (typ == 'e') grid ret = [h1]; return, end grid; h2 = line([x1 x2], [y1n,y2n]); set(h2,'LineWidth',0.5,'LineStyle',':','Color',str2); grid hold on ret = [h1 h2];% Ex3_3.m
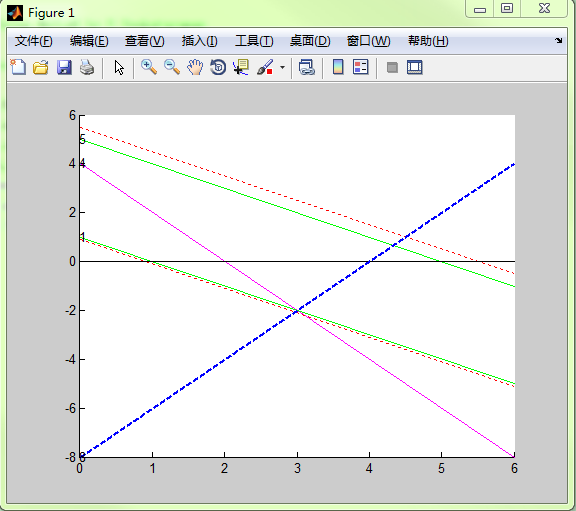
% Example 3.3 % Optimization Using MATLAB by P.Venkataraman % % Using drawLine.m % drawLine(0,6,1,1,5,'l');第一条线
画了过后
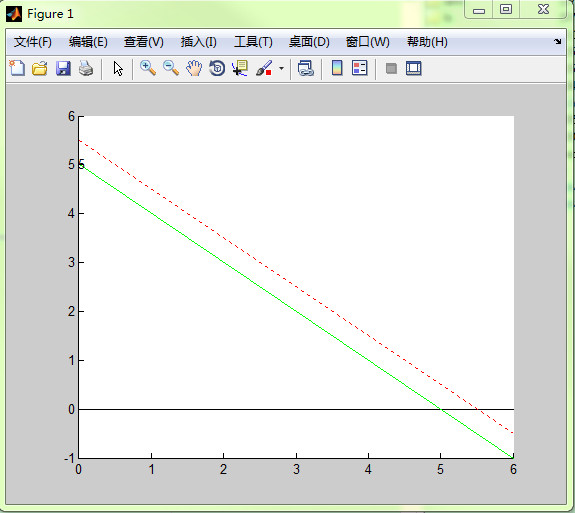
第一根线是绿线, 第二根线是红线, 表示绿线的左下部分是可行区域
drawLine(0,6,2,1,4,'e');第二条线
画了过后, 这里用紫线表示
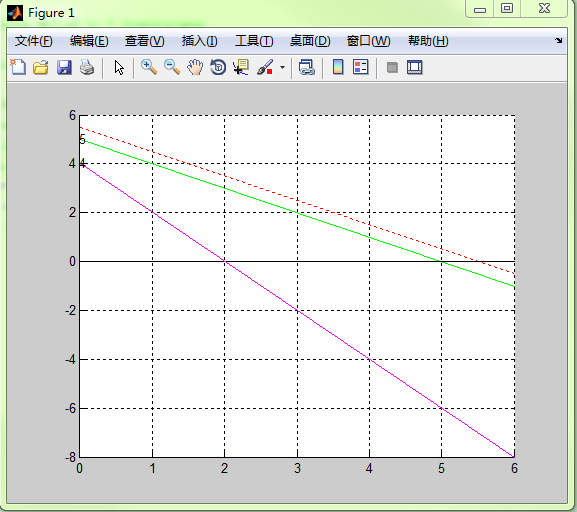
第三条线
画了过后
红线在此绿线的左下角,则说明可行区域在绿线的右上角部分
drawLine(0,6,2,-1,8,'n');目标函数
画完过后,这里用蓝虚线表示,这里目标函数的意义为与Y轴截距的负值
你可能感兴趣的文章
计算机的发展史
查看>>
带WiringPi库的交叉编译如何处理一
查看>>
带WiringPi库的交叉笔译如何处理二之软链接概念
查看>>
Spring事务的七种传播行为
查看>>
ES写入找不到主节点问题排查
查看>>
Java8 HashMap集合解析
查看>>
欢迎使用CSDN-markdown编辑器
查看>>
Android计算器实现源码分析
查看>>
Android系统构架
查看>>
Android 跨应用程序访问窗口知识点总结
查看>>
各种排序算法的分析及java实现
查看>>
SSH框架总结(框架分析+环境搭建+实例源码下载)
查看>>
js弹窗插件
查看>>
自定义 select 下拉框 多选插件
查看>>
js判断数组内是否有重复值
查看>>
js获取url链接携带的参数值
查看>>
gdb 调试core dump
查看>>
gdb debug tips
查看>>
arm linux 生成火焰图
查看>>
linux和windows内存布局验证
查看>>